
Share this
by Jordan Wilton on November 12, 2026
TL;DR: Project profitability comes down to seven numbers: revenue, delivery cost, project margin, billable utilization, burn rate, budget variance and forecast margin. Check them every week while the project runs, not after the final invoice.
Most services firms learn a project's real margin after the final invoice, when the hours are spent and the overrun can't be undone. Project profitability metrics fix the timing: tracked weekly, seven numbers tell you whether a project is making money while you can still change the staffing or the scope. Below: each metric with its formula, all seven run on one example project, and how to put them on a single dashboard.
What is project profitability, and why measure it during the project?
Project profitability is what a project earns after the cost of delivering it. Most firms express it as a margin, the share of the price they keep. It's worth measuring during the project because most of the cost is people's time, and spent time doesn't come back. A weekly check still gives you the chance to change course, which a number at the end of the project never will.
For where professional services firms lose margin and how to win it back, see our guide to improving project profitability. This article covers the full set of project management metrics that show where a margin is heading.
Early numbers tell you more than you'd expect. The U.S. Government Accountability Office's Cost Estimating and Assessment Guide notes that, according to the studies it cites, performance indicators can predict a program's final outcome once it's 15% complete. GAO advises reviewing the data at least monthly, and says some labor-heavy programs review it weekly in labor hours, the unit services firms already track.
What are the key metrics for evaluating project profitability?
Seven project management KPIs cover project profitability: revenue, delivery cost, project margin, billable utilization, burn rate, budget variance and forecast margin. The first three show where a project stands today. Utilization shows whether the team behind it is used well, and the last three give you an early warning. Review the project numbers weekly and roll them up monthly.
Professional services KPIs for project profitability: formula, meaning, review rhythm and owner
| Metric | Formula | What it tells you | Review | Usual owner |
|---|---|---|---|---|
| Revenue (earned) | Fixed fee: % complete × contract value. Time and materials: billable hours × rate | What you've earned so far, which isn't always what you've invoiced | Weekly | Finance |
| Delivery cost | Hours logged × cost rate per person + expenses | What the project has cost to date | Weekly | Project manager |
| Project margin | (Revenue − delivery cost) ÷ revenue × 100 | Whether the work pays | Weekly per project, monthly across projects | Project manager and finance |
| Billable utilization | Billable hours ÷ available hours × 100 | How much paid time becomes billable work | Weekly per person, monthly per team | Operations or resource lead |
| Burn rate | Hours or cost logged per week | How fast the budget is being used | Weekly | Project manager |
| Budget variance | Planned cost to date − actual cost to date | Whether spending is ahead of the plan | Weekly | Project manager |
| Forecast margin | (Revenue − (actual cost to date + planned cost of remaining work)) ÷ revenue × 100 | Where the margin will land if the plan holds | Weekly | Project manager, reviewed by the owner |
What is project revenue?
Project revenue is the value of the work delivered so far. On time-and-materials work, it's billable hours times the rate. On a fixed fee, it's the share of the fee you've earned, based on how complete the work is. That figure often differs from what you've invoiced, because invoices follow the payment schedule rather than the work.
Accounting rules draw the same line. Under IFRS 15, revenue on work delivered over time follows progress, and BDO explains that this usually won't match the amount invoiced. Use earned revenue on a profitability dashboard and keep invoiced revenue for the cash view.
What is delivery cost?
Delivery cost is every hour logged on a project, billable or not, multiplied by that person's cost rate, plus expenses such as subcontractors and travel. The cost rate is what an hour of someone's time costs you, salary and benefits included. The rate you bill the client is a different number.
Project cost tracking starts there: check that every person on the project has a cost rate before you build any report. Without cost rates, a tool compares revenue with an incomplete cost, and the project looks healthier than it is.
What is project margin?
Project margin, also called project profit margin, is a project's revenue minus its delivery cost, divided by revenue. It's the core number in any project profitability analysis because it lets you compare projects of any size. To calculate project profitability for one project, use this formula:
Project margin (%) = (revenue − delivery cost) ÷ revenue × 100
Two mistakes are common. Dividing cost by revenue gives the cost ratio, and dividing profit by cost gives the markup. A project with $6,000 in revenue and $4,500 in cost has a 25% margin, a 75% cost ratio and a 33.3% markup.
What is billable utilization?
Billable utilization is the share of a person's available hours spent on billable work. It describes the team rather than a single project: a project can stay on budget while the people around it sit half idle, and the firm still pays for every unbilled hour.
Billable utilization (%) = billable hours ÷ available hours × 100
SPI Research's 2026 benchmark of 509 professional services firms found billable utilization fell to 66.4% in 2025, the lowest in the survey's 19-year history. More isn't always better, though: SPI's research found that utilization between 70% and 80% historically gave the best profitability, while firms above 80% saw more burnout and attrition. For planning around utilization, read why you still need resource management software.
What is burn rate in project management?
Burn rate is how fast a project uses its budget, measured in hours or money per week. It only means something next to two other numbers: how much of the timeline has passed and how much of the work is done. If you've used 65% of the budget at the halfway point with 55% of the work finished, the burn rate is your warning.
Some guides define burn rate as total budget divided by project length, but that's only the planned pace to compare against.
What is budget variance?
Budget variance is the difference between what you planned to spend by now and what you've actually spent. A negative number means you're over the plan.
Budget variance = planned cost to date − actual cost to date
Budget variance only measures spending against the plan. It doesn't account for how much work got done. A team that's ahead of schedule shows a negative budget variance even when every task cost exactly what it should. That's why it needs cost variance, explained further down.
What is forecast margin?
Forecast margin is the margin a project will end with if the current plan holds. Add the actual cost to date to the planned cost of the remaining work, and compare the total with the project's revenue.
Forecast margin (%) = (revenue − (actual cost to date + planned cost of remaining work)) ÷ revenue × 100
If you only track one number, make it this one. It's the only metric of the seven that looks forward. It's also only as good as the plan behind it: if nobody updates the remaining hours, the forecast is just the original quote.
How do the seven metrics work together on one project?
Run the seven metrics on one project and they tell a single story. In the hypothetical fixed-fee project below, at week four of eight, spending is running ahead of the work done and the forecast margin has slipped 7.5 points. No single metric shows that as clearly as the full set.
A worked example (hypothetical): A 25-person agency sells a website project for a $60,000 fixed fee. The plan is 400 hours over eight weeks at a blended cost of $75 an hour: $30,000 in delivery cost and a 50% margin. Half the fee is invoiced at kickoff. At the end of week four, the team has logged 260 hours and estimates the work is 55% complete. The resource plan shows 200 hours to go.
The worked example at week four of eight (hypothetical)
| Metric | At week four | Plan for week four | What it says |
|---|---|---|---|
| Revenue earned | $33,000 (55% of $60,000) | $30,000 | More than half the work is done; $30,000 has been invoiced |
| Delivery cost to date | $19,500 (260 hours × $75) | $15,000 (200 hours) | Spending is ahead of the plan |
| Project margin to date | 40.9% | 50% | Margin is already slipping |
| Burn rate | 65 hours a week ($4,875) | 50 hours a week ($3,750) | 30% faster than planned |
| Budget variance | −$4,500 | $0 | 60 hours over the plan |
| Cost variance | −$3,000 | $0 | The finished work cost more than budgeted |
| Forecast margin | 42.5% | 50% | The final margin is heading 7.5 points low |
The forecast is 260 hours spent plus 200 planned: 460 hours, or $34,500, which leaves a 42.5% margin on $60,000.
Budget variance puts the project $4,500 over plan. Cost variance shows $3,000 of that is real overspend on finished work, and the other $1,500 is schedule variance: work done earlier than planned. So the team is working fast, and it's also spending more per task than the quote assumed.
Utilization isn't in the project's row, so check it for the people on the project. If the senior designer is at 90%, the overrun may come from one overloaded person rather than the scope. At week four there's still time for a change order or a staffing change, which won't be true by week eight.
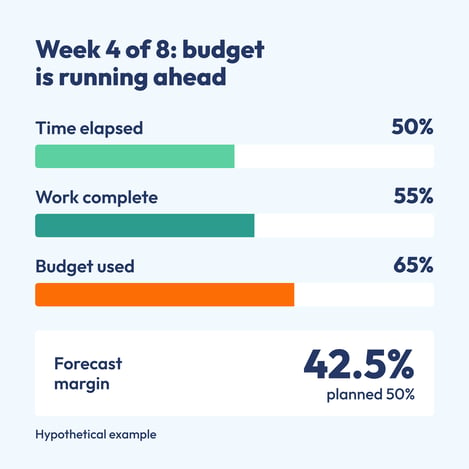
Hypothetical example. Budget used running ahead of work complete is the earliest margin warning.
What's the difference between budget variance, cost variance and estimate at completion?
Budget variance compares spending with the plan, cost variance compares it with the work actually done, and schedule variance shows whether the work is ahead or behind. Estimate at completion predicts the total cost. Use budget variance as the quick alarm, the other two to explain it, and the estimate to size the damage.
Budget variance vs. cost variance vs. schedule variance vs. estimate at completion
| Term | Formula | Question it answers | Worked example at week four |
|---|---|---|---|
| Budget variance | Planned cost to date − actual cost to date | Are we spending faster than planned? | −$4,500 |
| Cost variance | Earned value − actual cost, where earned value = % complete × total budget | Did the finished work cost more than it was budgeted to? | −$3,000 |
| Schedule variance | Earned value − planned cost to date | Is the work ahead of or behind the plan, in money? | +$1,500 |
| Estimate at completion (EAC) | Actual cost to date + cost of remaining work | What will the project cost in total? | $34,500 |
Cost variance and estimate at completion come from earned value management, the method the GAO's cost guide describes for large programs. In GAO's definition, a positive cost variance means work was completed under budget and a negative one means it cost more. Schedule variance closes the loop: budget variance equals cost variance minus schedule variance, so in the example −$4,500 = −$3,000 − $1,500. All of these work without full earned value management, as long as you have hours, cost rates and an honest estimate of how complete the work is.
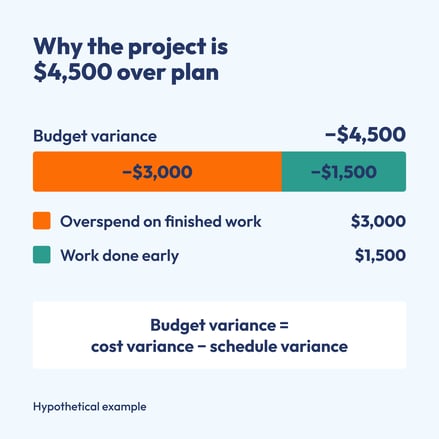
Hypothetical example. Only the orange part is real overspend; the rest is work done ahead of schedule.
How do you set up a dashboard for project profitability metrics?
A project profitability dashboard needs one row per active project and five columns: budget used, work complete, forecast margin, budget variance and work earned but not yet invoiced. Add a separate team view for utilization. Project managers review their rows weekly, and the owner or finance reviews the monthly roll-up.
- Fix the inputs first. Every person needs a cost rate, and timesheets need to be complete each week. A dashboard built on half the hours shows a margin that doesn't exist.
- Sort by forecast margin, worst first. The projects that need attention rise to the top on their own.
- Put budget used next to work complete. The gap between the two is the earliest warning on the page.
- Set a threshold that starts a conversation, such as budget used running 10 points ahead of work complete. Tune that number to your firm; it isn't an industry benchmark.
- Give utilization its own view per person, and roll the projects up monthly by client and type. The monthly view is what improves your next quote.
- Close every project with a margin review. Compare the quoted margin with the actual one and note where the extra hours went. A few of these reviews per project type show which kind of work you keep underpricing.
Example weekly project view (hypothetical figures)
| Project | Budget used | Work complete | Forecast margin | Budget variance | Earned, not yet invoiced |
|---|---|---|---|---|---|
| Website project | 65% | 55% | 42.5% | −$4,500 | $3,000 |
| Brand refresh | 40% | 45% | 51% | +$900 | $0 |
| CRM migration | 80% | 70% | 31% | −$6,200 | $8,400 |
None of this works without complete data. ITSEC, a cybersecurity and compliance consultancy, used to keep time, financial data and planning in different tools. After moving them into one system, ITSEC reports that timesheet completion reached 99% within four months, and that data for monthly reviews, which used to take days to pull together, is now ready in seconds.
"Without PSOhub, we would struggle to maintain visibility into project performance and margins."
Sebastien, CFO, ITSEC
Want budgets, hours and margin in one project record instead of three tools? See how project management in PSOhub connects them, from the first booked hour to the final margin.
Which project management platforms offer built-in profitability analysis?
Professional services automation (PSA) platforms offer built-in profitability analysis; most general project management tools don't, and the difference comes down to what each one stores. Profitability analysis needs a cost rate for every person, a budget for every project or contract line, and time logged against both. General tools track hours and tasks, but rarely cost rates or contract values.
Where each type of tool stands on project profitability analysis
| Setup | Shows margin? | How current is it? | Where it breaks |
|---|---|---|---|
| Spreadsheets | Yes, if someone builds and maintains it | As current as the last export | Manual updates, broken formulas, one person who understands it |
| Project management tools without financials | Rarely; they track hours, not money | Live for hours, not for cost or revenue | No cost rates, contract values or invoices |
| PSA platforms | Yes, built in | Updates as time is approved | Need cost rates and steady timesheet habits, and more setup at the start |
Whatever you use, built-in profitability analysis means the tool can:
- hold a cost rate per person, separate from the bill rate
- give each project, or each contract line, its own budget
- update cost and margin in real time as hours are approved, without an export
- show estimated and actual margin side by side
- send the data to Excel or a BI tool for custom reports
In SPI Research's 2026 survey of 101 firms using PSA software, average project margin rose from 32.9% before PSA to 39.7% after, and on-time delivery from 75.8% to 82.9%. PSA users reported these figures themselves, so they show a direction and can't predict your own result.
PSOhub is one PSA platform that works this way. It shows estimated and actual profitability side by side for each project, and calculates actual margin from each team member's cost rate and booked hours. For reports beyond the built-in ones, Key Engineering Solutions, a services company specializing in control systems and instrumentation, pulls its PSOhub project data into Power BI or Excel through an OData link for weekly and monthly reports.
When do profitability metrics mislead you?
Profitability metrics mislead when the inputs are wrong or the view is too wide. Missing cost rates, late timesheets and a guessed percentage complete all produce clean-looking numbers that are wrong. An average across all your projects can also hide the one project that sinks the quarter.
- Late timesheets. The margin looks fine all week and then drops on Friday, when everyone fills in their hours at once.
- A guessed percentage complete. A project that has been "70% done" for three weeks is a warning in itself, and earned revenue and cost variance both depend on that estimate.
- Averages. Bent Flyvbjerg and Alexander Budzier analyzed 1,471 IT projects and found an average cost overrun of 27%, which hid the real risk: one project in six overran by 200% on average. Review each project, not only the portfolio.
- Very small teams. With fewer than 10 people and a few projects at a time, a spreadsheet you update weekly can cover these metrics. It gets harder to keep accurate with every project and person you add.
Frequently asked questions
Is the profitability index the same as project margin?
No. The profitability index is a capital-budgeting ratio: the present value of an investment's future cash flows divided by its upfront cost. It helps decide whether an investment is worth starting. Project margin measures how much of a client project's price you keep after delivery cost. For client work in a services firm, track project margin.
Is project margin the same as gross margin?
Not quite. Project margin covers one project: its revenue minus the cost of delivering it. Gross margin usually covers the whole firm over a period, so it also carries the cost of delivery time nobody billed to a project, such as bench time. That's why a firm's gross margin is normally lower than its average project margin.
How many profitability KPIs should a small firm track?
Start with three: forecast margin per project, budget used against work complete, and work earned but not yet invoiced. Together they show where each margin is heading, which projects are running hot, and whether finished work is turning into revenue. Add utilization per person once your timesheets are complete every week.
Should project managers see individual cost rates?
They don't need to. Many firms show project managers a blended cost rate per role, or only the resulting cost and margin, while finance keeps individual salaries private. What matters is that the margin a project manager sees is based on real cost, even if the rates behind it stay hidden.
What's the difference between a project KPI and a project metric?
A metric is any number you measure, such as hours logged this week. A KPI is a metric you've tied to a target and review on a schedule, such as forecast margin above 40% on every active project. All seven numbers in this article are metrics. The ones you set targets for become your project KPIs.
How do you measure profitability on a retainer?
Treat each retainer period as its own small project. Compare the month's fee with the delivery cost of the hours logged against it, and track how many of the included hours were used. A retainer that's regularly overused is quietly underpriced. One that's regularly underused is a renewal risk.
Check your three largest projects this week
Pick your three largest active projects. For each one, compare budget used with work complete, and work out the forecast margin from hours spent plus hours still planned. If any project is more than a few points below its quoted margin, you've found this week's most useful conversation.
Want help setting this up for your own projects? Book a 20-minute discovery call.
PSOhub is professional services automation software for consulting, IT services, agency, engineering and financial services firms. It connects to HubSpot, Salesforce, Microsoft Dynamics 365 and Pipedrive.
Reviewed by Claudette Albers-Reid, Customer Success Manager
Share this