Share this
by Jarno Koopman on January 18, 2023
Updated on January 15, 2025
Overview: Utilization rates are calculated and monitored by project managers to help keep projects profitable and on time. These percentages reflect how much work each team member has on their plate against their availability.
1. What is employee utilization rate?2. What can businesses learn from employee utilization rates?
3. How to calculate employee utilization rate
4. How to track employee utilization rate
5. What is considered a good utilization rate?
6. How project management software can help you manage utilization rates
7. Employee utilization rate vs billable utilization rate: What’s the difference?
8. Improve utilization rates with PSOhub
We all want to increase our productivity and profitability. Putting this goal into practice is something else.
As with most things in life, knowledge serves as the precursor to any kind of positive change.
When it comes to your team’s productivity and billability, one of the best metrics of value is the employee utilization rate.
Knowing your employee utilization rates can give you major insights into how your business is running and where there’s room for improvement.
Leveraging these metrics can help you increase your team’s billable hours. And anomalous employee utilization rates can alert you that something is amiss with your workflows.
For example, if someone’s utilization rate repetitively goes over 100% (aka burnout range), there may be an opportunity to adjust the workflow, so that their work gets shared with one or even two other team members who can afford to pick up the slack.
In this article, you’ll learn how to calculate and track the utilization rates of your employees.
What is employee utilization rate?
Employee utilization rate equals the amount of time an employee engages in work versus their total work availability aka capacity.
Employee utilization rate is reflected in a percentage; it’s also sometimes referred to as the capacity utilization rate.
Here’s an easy example:
Let’s say that last week, employee A spent 2 hours on internal admin and 28 billable hours on work directly related to projects and services. Employee A’s weekly availability is 35 hours.
The utilization rate for employee A is about 85.7% or (30/35) x 100%. That’s because 30 hours were spent working versus a total availability, or capacity, of 35 hours.
What can businesses learn from employee utilization rates?
The employee utilization rate demonstrates how much time your team is spending on work versus how much time they could be spending (according to their capacity).
You can also gain insight into productivity and efficiency with both individuals and teams by taking a look at employee utilization rates. Here’s what you can garner from these percentages:
Optimize resource allocation
Project managers can get a crystal clear vision into who may be on the verge of burnout and who on the team isn’t producing as much as they could be. From there, they can remedy the situation by changing workflows and/or redistributing tasks.
Utilization rates can also tell you whether or not employees are working on tasks conducive to their skillset.
For example, if someone’s utilization rate is repeatedly below par, they may need more challenging work. And on the flipside, if it’s always too high, perhaps there’s someone else on the team with a similar skillset to lighten the load and speed up deliverables.
Better project budgets & timelines
When utilization rates are tracked over time, they can give project managers better data by which to base budgeting decisions. These metrics help PMs understand how certain employees respond to certain tasks as far as productivity, and thus, how many hours to include in the quote.
Analysis of past utilization data can also help you arrive at a more accurate representation of how long the project will take. You can have a better idea from a data perspective of how fast the team works when operating at optimal utilization.
Boost team morale
Project teams are the heart and soul of the project itself. Their creativity, talent, and skills are what helps create amazing structures, brilliant designs, ingenious ad campaigns, and the like.
But when employees get burned out from shouldering too much of the project burden, their morale can wane. And consequently, so can the quality of the deliverables.
By tracking utilization rates, PMs can easily identify who may be at risk of burnout and find proactive solutions that can help create a more balanced situation.
It also holds those accountable who may be slowing the project down and causing the potential burnout.
At the end of the day, tracking this metric can help you quickly address imbalanced workloads and create a more supportive, harmonious team environment for everyone on the project.
Identify skill gaps & staffing needs
A utilization rate pattern can sometimes signify that there’s a critical gap in skills or that new team members need to join the fold to make the project run more efficiently.
For example, a consistently low utilization rate could signal that someone needs more skills or training.
On the flip side, a high utilization rate but low level of task completion could mean someone is spending too long on project tasks, and would also require additional training.
And if utilization rates are too often going over 100% for the entire team, you may want to consider bringing on additional staff to help balance the workload and ensure budget and timeline constraints are met.
More profitable projects
Increased project profit margins are the fruits of all the above. With optimal resource allocation, you can make sure everyone gets assigned to the tasks their best at while balancing workloads.
Analyzing historical utilization rates can also help you arrive at a more realistic budget and timeline. And perhaps most importantly, tracking these metrics can help you stay on top of the morale of your teams and identify who may need some extra support.
How to calculate employee utilization rate
Employee Utilization Rate = Work Hours ÷ Total Available Hours x 100%
Calculating employee utilization rate isn’t difficult, as long as you have your time-tracking data handy along with the capacity information of your individual employees.
Employee Utilization Rate will help you see how profitable and how productive your employees are when it comes to how they spend their time at work. And you need just two numbers to figure it out.
Here’s how to calculate the employee utilization rate:
Step 1- Choose the period of time you want to measure your employee utilization rate. You can calculate this measurement for a specific time frame or on a specific project/client.
Step 2- Go to your time tracking solution for the employee to look at the hours logged within the specified time frame.
Step 3- Determine the overall availability for work during the specified time frame for the employee. You may have to take a look at your resource management tool to retrieve this info or your capacity planning for a specific project.
Step 4- Divide the work hours by the overall available hours.
Step 6- Multiply times 100% to arrive at the employee utilization rate.
Here’s another example to help you understand utilization rate:
Employee B had a total availability of 50 hours to work on a project. Once the deliverables were sent, employee B logged a total of 35 work hours.
The employee utilization rate for employee B in this project is 70%.
35 work hours ÷ 50 available hours x 100% = 70% Employee Utilization Rate
How to track employee utilization rates
Figuring out the employee utilization rate requires just 2 figures: the number of hours worked and the total availability for that person.
To track the employee utilization rate over time, you have a couple of options:
Option 1- You can create a spreadsheet with Excel or Google Sheets. Create a column for all the employees, along with three additional columns to show tracked hours, availability or capacity, and employee utilization rate.
You can input a simple formula to divide the tracked hours column by the availability column. This is the formula for the utilization rate which will be reflected in the last column.
Option 2- You can track employee utilization rates with software that you may already use. Most resource management software will allow you to track utilization rates automatically.
PSA tools that include resource management can also track this for you and display the information on convenient dashboards.
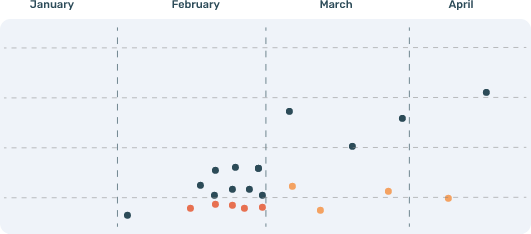
Example: PSOhub Team Utilization Dashboard
What is considered a good employee utilization rate?
Consulting firms and other professional services businesses earn revenue from highly skilled employees.
In professional services, hiring outstanding individuals with valuable skill sets can help you win more profitable clients and projects. But if your team members aren’t as productive as they should be,
What’s considered a ‘good’ employee utilization rate will vary by industry.
If your utilization rate target is too low, your team members may earn less revenue for the business and lack the incentive to be productive. On the flip side, if you set a utilization target that is too high, some employees may experience burnout. Burnout can negatively affect the customer experience as well as your company culture.
In most cases, the higher your employee utilization rate is, the better.
In professional services, 80% is considered the optimal employee utilization rate.
For consulting firms, best-in-class employee utilization hovers around 75%. And the foundational employee utilization rate is 71%.
Final verdict: 80% remains the goal for employee utilization rate. However, we can learn from the above numbers that anything 75% and up is considered a good utilization rate for professional services. Utilization rates that fall at or below the low 70s may need to be addressed to improve efficiency and profitability.
How project management software can help you manage utilization rates
You can use your project management software to help you manage utilization rates by letting it calculate and track these percentages for you.
With a capacity planner feature, you can fill out each individual team member’s capacity during project planning. If something changes along the way, simply edit the capacity to reflect accurate utilization.
From here, as long as your project management software has a built-in time tracker or at least integrates with your time tracking tool, it can automatically pull individual hours and measure them against capacity.
Project management software can make these percentages easily accessible to you at a glance, on your task board, your Gantt chart, or even your project dashboard if you choose.
And the best part is that project management software will keep all that data, which you can then spit out into reports and use to forecast projects in the future.
Employee Utilization Rate vs Billable Utilization Rate: What’s the difference?
Employee utilization rate and billable utilization are both figures that can show you how productive and billable your team is. However, they are not exactly the same thing. Here’s the difference:
Employee utilization rate measures work time in relation to total available time (capacity).
Billable utilization rate measures billable time in relation to capacity.
For example: An employee has 20 billable hours for one week, in addition to 5 hours spent working on internal admin tasks. The total availability for the week was 30 hours.
The employee utilization rate is 83.3% or 25÷30 x 100%.
The billable utilization rate is 66.7% or 20÷30 x 100%.
For this employee, we can see that they have a good overall utilization, as it is above 80%.
We also see that this employee is productive with their work time, dedicating 80% of their total work to billable tasks.
However, the billable utilization rate is below 70%, which means there is room for improvement. By reducing the internal, non-billable admin time of this employee, the billable utilization rate will theoretically be higher.
Improve Utilization Rates with PSOhub
Identifying and tracking employee utilization rates over time can help project managers and owners increase the billability of their teams.
Armed with the utilization data, you can address problems more quickly and optimize the efficiency of your team.
A resource management tool can track utilization rates for you and display them on a real-time dashboard.
Moreover, a PSA tool like PSOhub can make things even easier by connecting to all the other moving parts of your project management.
That means invoicing and time tracking are connected with capacity planning. When your team tracks time, you can have that time automatically applied to an invoice that is generated according to your billing parameters. You can track the profitability of your projects easily with accurate data.
Because PSA tools are designed for professional services and are stacked with automated features, you can easily see your utilization rates at a glance. You can track employee utilization rate over time accurately, without the legwork.
Frequently asked questions about employee utilization rate
What is the employee utilization rate formula?
Employee utilization rate = (Billable hours / Total available hours) x 100. For example: if a consultant has 160 available hours in a month and logs 128 billable hours, their utilization rate is 80%. Track this weekly by individual, team, and role to catch patterns early rather than at month-end.
What is a good employee utilization rate for a consulting firm?
Target utilization rates vary by role. Senior consultants and partners typically target 65–75% to allow time for business development and knowledge sharing. Mid-level consultants target 75–85%. Junior consultants and analysts typically target 80–90%. Rates above 90% for extended periods indicate overload risk; rates below 60% indicate an underutilization problem that is costing revenue.
What is the difference between utilization rate and realization rate?
Utilization rate measures billable hours as a percentage of available hours. Realization rate measures the revenue actually collected as a percentage of the revenue that should have been collected at full billing rates. A firm can have high utilization but low realization if hours are discounted, written off, or not invoiced. Both metrics matter: utilization measures effort, realization measures commercial effectiveness.
How do you track employee utilization rate in practice?
Track utilization weekly using time tracking software that connects hours logged to project budgets. Calculate utilization by role and by team rather than only at the individual level — this shows capacity patterns and bottlenecks that individual-level data misses. Review utilization in a weekly operations meeting alongside project margin data.
Why is employee utilization rate important for professional services profitability?
Every percentage point of billable utilization translates directly to revenue. For a team of 20 consultants each billing at $150/hour with 160 hours of capacity per month, a utilization rate of 75% versus 80% represents a monthly revenue difference of approximately $24,000. Improving utilization by even 5 percentage points across the team has a significant impact on firm profitability without adding headcount.
How do you improve employee utilization rate?
Improve utilization by: connecting your CRM pipeline to resource planning so team members are staffed before projects start; reducing non-billable overhead through automation; improving time tracking compliance so billable hours are captured; cross-training team members to reduce skill-based bottlenecks; and reviewing utilization weekly rather than monthly so problems are caught before they compound.
Share this