Share this
by Juliette Lagerweij on May 18, 2022

Gantt charts are insanely popular with certain industries and roles. Many others around the digital water cooler have no idea what they are.
Gantt charts are the project management tool of choice among managers and owners to plan the timelines of their more complex projects.
Project charts– as they’re also known– appear to be only growing in popularity, especially since more teams have moved online and switched to asynchronous work in the past two years.
We investigate whether or not Gantt charts make project management easier. Our discussion is based on our own experience, that of PSOhub users, and the pros and cons of using Gantt charts to help manage your project workload.

What are Gantt charts?
This one is for all the people scratching their heads, asking, “What the hell is a Gantt chart?” Don’t feel bad; you may have also heard them referred to as project charts. The concept is basic:
Gantt charts are horizontal bar graphs that chart activity against time.
The Gantt chart is an intelligent bar graph that maps out the timeline of your projects. It looks like this:
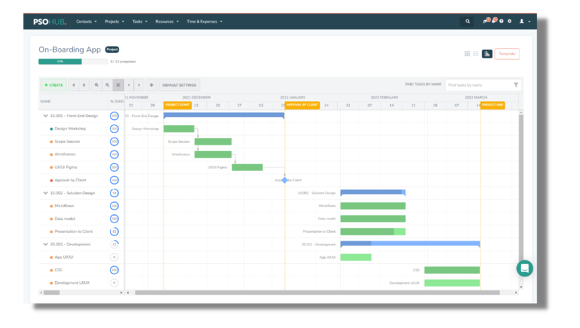
Here you can see how everything has been planned and scheduled with different stakeholders as owners of different tasks. Dependencies are set too, making it impossible for the timeline to continue until certain tasks have been completed.
The strength of the Gantt chart is in the visual itself– you can get a detailed report of where your project stands against time with just a glance.
How granular you get with your Gantt chart is largely up to you and the nuances of the project at hand. In fact, Gantt charts are preferred for planning projects that require getting more granular. Otherwise, they might not be worth the time.
The overarching purpose of the Gantt chart
Within a linear timeline, Gantt charts dissemble complicated projects into manageable steps.
The Gantt chart exists to break down complex tasks at multiple stages into a simple, organized format. For projects that have multiple stakeholders and dependencies that need to be tracked, the Gantt chart provides at-a-glance insight into the project’s overall timeline as well as the current status. They also provide powerful visual information to help managers and owners gain a more holistic idea of where each project stands and what’s involved to move it forward at any given time.
Complex, macro, long timeline → Simple, micro, shorter timelines

Defining features of a Gantt chart/project chart
What makes a Gantt chart a Gantt chart? I.e. How is it different from a simple, horizontal bar graph?
In a nutshell, Gantt charts or project charts are designed to help with workload management and task management:
Who is responsible for what? How long is each task predicted to take? What are dependencies and milestones that need to be reached? Where does the deadline fit with what’s going on today? Are you ahead or behind? To answer all these questions and keep things on track, Gantt charts provide the following features:
Planning, scheduling- When you are setting up your Gantt chart, you are essentially planning and scheduling your project.
Start/End dates- Gantt charts allow you to input start and end dates for individual tasks and for the project as a whole; these may change if the scope of the project evolves.
Dependencies- Gantt charts clearly delineate tasks that include dependencies, meaning they cannot be completed or sometimes even begin until a dependent task is complete.
Deadlines- Deadlines are clearly marked for each project, task, and stakeholder, helping managers, owners, and team members know when deliverables are expected.
Milestones- Similar to dependencies, certain projects require milestones to be hit in order to receive payment. Gantt charts display milestones where applicable for projects that require them.
Tracking- Gantt charts are used to track the progress of your project over time. If you use a Gantt chart with project management software, for example, you can see where your project stands at any point not just in relation to time, but in relation to capacity, budget, and more.
Gantt charts give managers and owners instant information about the status of the project. With a Gantt chart, you can easily see what percentage of each task is complete and who is in charge of that task aka who is the stakeholder.
Who uses Gantt charts?
Gantt charts have been around since the early 20th century. Gantt charts are a popular project management tool used in a variety of industries and for a variety of projects, including:
- Architecture
- Creative projects like web content, films, and more
- Construction
- Software development
- Marketing campaigns
- Design
- Fit-out firms
- Non-profits
- Agriculture
- And more
When are Gantt charts most helpful?
- Gantt charts are most helpful when you need to simplify and break down complex projects with more than just a task list.
- Gantt charts are helpful for projects where the scope is bound to change.
- Projects with multiple stakeholders are good candidates for Gantt charts.
- Gantt charts are useful for asynchronous work where team members may be working at various times around the world.
- Gantt charts give managers, owners, stakeholders, and sometimes clients a succinct visual display of the entire project.

Gantt Chart Pros
- Break down complicated projects into phases, smaller steps
- Understand project progress with just a glance
- Easily see timelines and deadlines of all tasks in one visual
- See the interdependence of all the project tasks clearly
- Great way to plan projects with multiple milestones/dependencies
- Increased transparency
- Increased visibility
Gantt Chart Cons
- Too much time to create for more simple projects
- If not integrated with your project management solution, may require more time than it’s worth
Do Gantt charts make project management easier?
Gantt charts make project management easier, provided that:
- The project is complex enough to necessitate a Gantt chart.
- Your Gantt chart is integrated with your project management solution. Otherwise, you may spend too much time migrating data and risk errors from manual entry.
Gantt charts map out tasks that are done in parallel and in a linear time format. Because of that simple-yet-effective functionality, you can easily see all the tasks that are going on for a project and how that relates to the overall timeline.
When your Gantt chart is provided by or integrated with your project management software, you can additionally see what’s happening in relation to capacity. For example, if you have a dependent task that is overdue, with just a couple clicks you can see who is responsible for the overdue task, what their capacity looks like, and the current capacity percentage of other team members. From there you can make a forward-moving decision to add an additional person to the task, reassign it, etc.
And whenever you change course during the project like in the example above, an integrated Gantt chart will show you how that affects your end date and your budget.
Free, friendly Gantt charts for project management
PSOhub includes Gantt charts in an all-in-one project management suite. Gantt charts by PSOhub are smart work charts that will automatically ‘talk’ to your other project data, including:
- Your contract/budget
- Your time tracking
- Your capacity (resource management)
- Even your invoicing
Gantt charts are a fantastic– sometimes critical– tool for many small businesses in professional services. They provide increased visibility and importantly, an accurate visual to display what is happening with complicated projects. The genius of the Gantt chart is that it can relay a ton of details and dependencies in an organized way that can be grasped instantly. This makes Gantt charts invaluable for many managers in software development, content creation, construction, design, and more.
Try out PSOhub for FREE and see if easy, intelligent Gantt charts can make your life easier. 
Share this